This article shows how to calculate the descriptive analysis of equal
weight, best case, and worst case for sector profile.
Example product-level output of sector profile for best case and
worst case
| comp_1 |
france |
1.5C RPS |
2030 |
0.25 |
0.25 |
0.25 |
| comp_1 |
france |
NZ 2050 |
2030 |
0.85 |
0.85 |
0.85 |
| comp_2 |
france |
1.5C RPS |
2030 |
0.10 |
0.10 |
0.10 |
| comp_2 |
france |
NZ 2050 |
2030 |
0.30 |
0.30 |
0.30 |
| comp_3 |
austria |
1.5C RPS |
2030 |
0.35 |
0.35 |
0.35 |
| comp_3 |
austria |
NZ 2050 |
2030 |
0.55 |
0.55 |
0.55 |
| comp_4 |
austria |
1.5C RPS |
2030 |
0.70 |
0.70 |
0.70 |
| comp_4 |
austria |
NZ 2050 |
2030 |
0.20 |
0.20 |
0.20 |
| comp_5 |
germany |
1.5C RPS |
2030 |
0.70 |
0.70 |
0.70 |
| comp_5 |
germany |
NZ 2050 |
2030 |
0.20 |
0.20 |
0.20 |
| comp_6 |
netherlands |
1.5C RPS |
2030 |
0.70 |
0.70 |
0.70 |
| comp_6 |
netherlands |
NZ 2050 |
2030 |
0.20 |
0.20 |
0.20 |
| comp_7 |
spain |
1.5C RPS |
2030 |
0.70 |
0.70 |
0.70 |
| comp_7 |
spain |
NZ 2050 |
2030 |
0.20 |
0.20 |
0.20 |
Average sector_profile_equal_weight per grouping_sector
and sector_category
avg_per_benchmark_risk_category <- function(data, col) {
  data |>
    select(all_of(c("companies_id", "scenario", "year", col))) |>
    distinct() |>
    mutate(risk_category = categorize_risk(.data[[col]],
                                           low_threshold = ifelse(.data$year == 2030, 1 / 9, 1 / 3),
                                           high_threshold = ifelse(.data$year == 2030, 2 / 9, 2 / 3))) |>
    mutate(grouping_sector = paste(.data$scenario, .data$year, sep = "_")) |>
    select(-c("scenario", "year")) |>
    filter(!is.na(.data[[col]])) |>
    summarise(total_mode = n(), .by = c("grouping_sector", "risk_category")) |>
    mutate(proportion = total_mode / sum(total_mode), .by = c("grouping_sector")) |>
    select(-all_of(c("total_mode"))) |>
    distinct() |>
    filter(!str_detect(grouping_sector, "NA"))
}
avg_sector_profile_equal_weight_per_benchmark_risk_category <- avg_per_benchmark_risk_category(sector_company_example, "sector_target_avg_equal_weight") |>
  rename("Average `sector_target_avg_equal_weight`" = "proportion")
Bar plot

Average sector_target_avg_best_case per grouping_sector
and sector_category
Bar plot

Average sector_target_avg_worst_case per
grouping_sector and sector_category
Bar plot

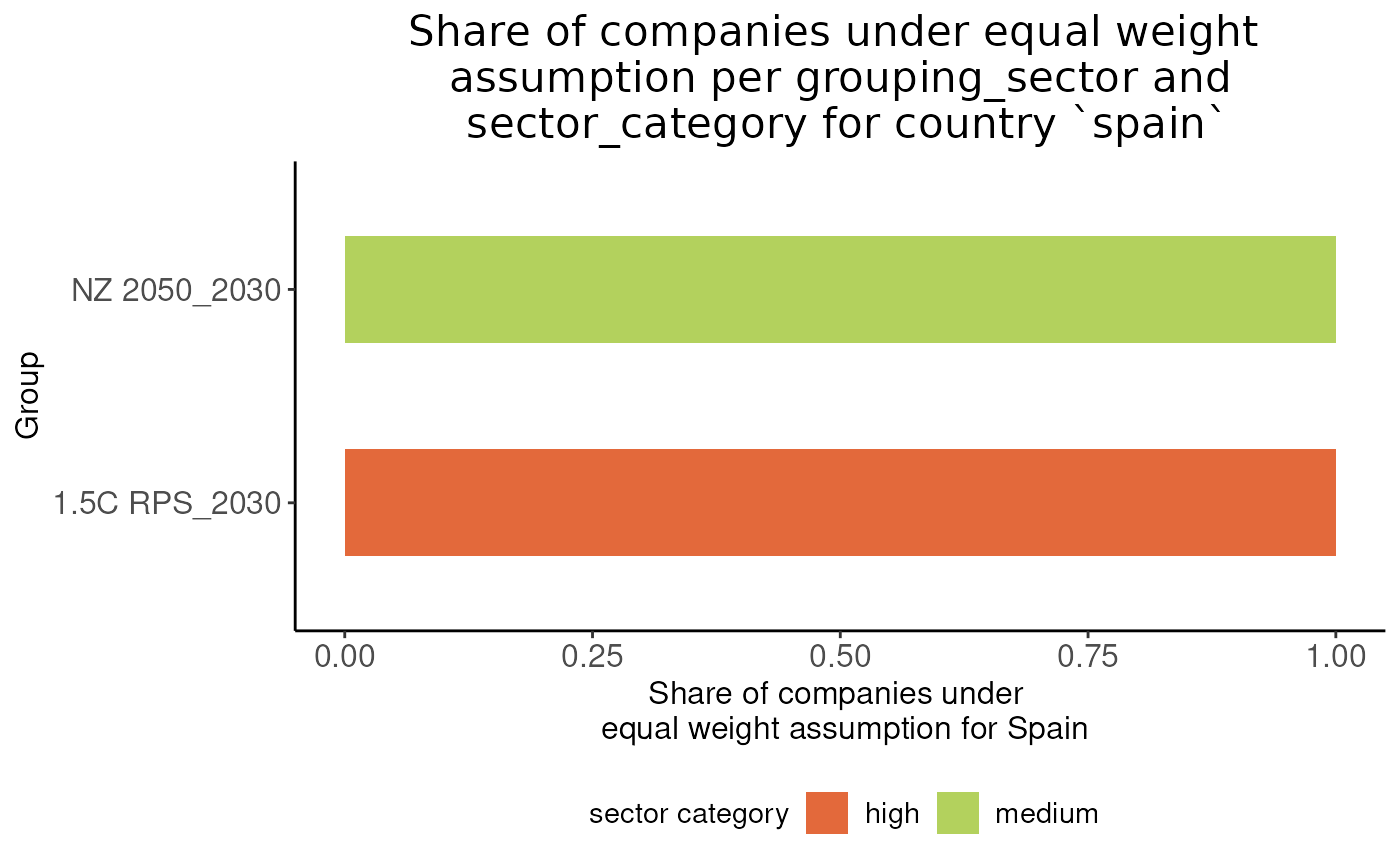
Average sector_target_avg_equal_weight per
grouping_sector and sector_category for a country
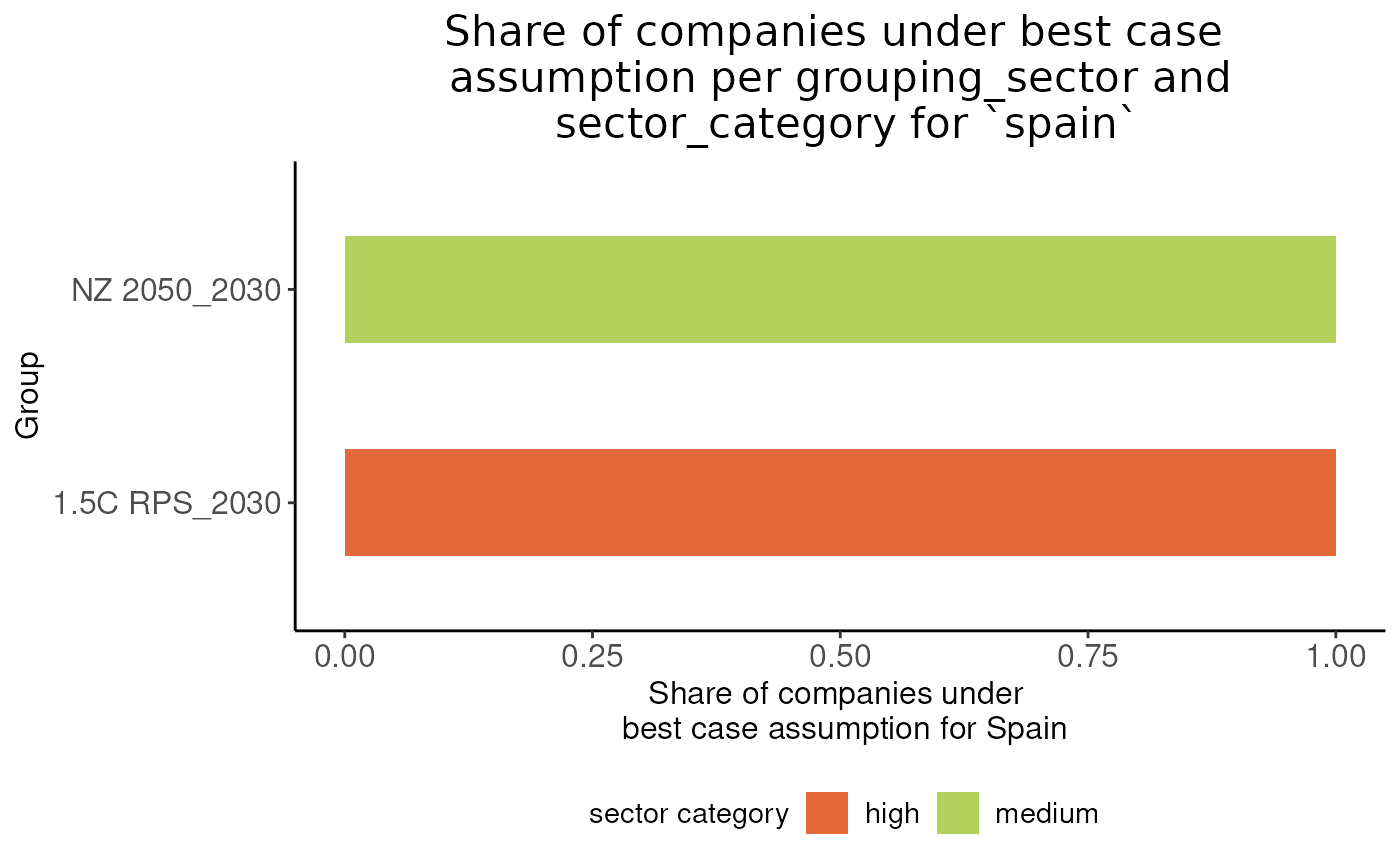
Average sector_target_avg_best_case per grouping_sector
and sector_category for a country
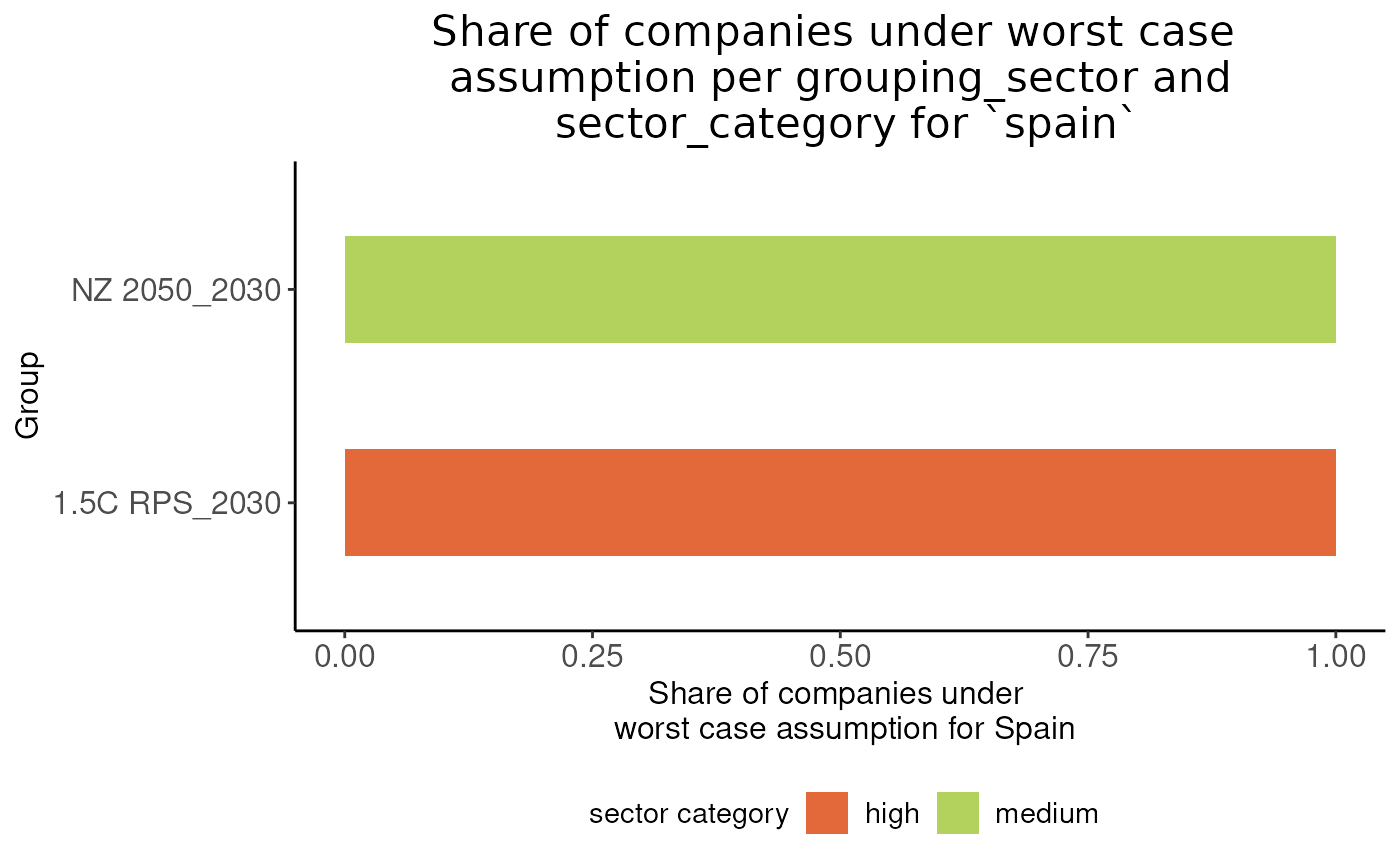
Average sector_target_avg_worst_case per
grouping_sector and sector_category for a country
Example company-level output of transition risk profile for best
case and worst case of sector profile
| comp_1 |
france |
1.5C RPS |
2030 |
0.25 |
0.25 |
0.25 |
| comp_1 |
france |
NZ 2050 |
2030 |
0.85 |
0.85 |
0.85 |
| comp_2 |
france |
1.5C RPS |
2030 |
0.10 |
0.10 |
0.10 |
| comp_2 |
france |
NZ 2050 |
2030 |
0.30 |
0.30 |
0.30 |
| comp_3 |
austria |
1.5C RPS |
2030 |
0.35 |
0.35 |
0.35 |
| comp_3 |
austria |
NZ 2050 |
2030 |
0.55 |
0.55 |
0.55 |
| comp_4 |
austria |
1.5C RPS |
2030 |
0.70 |
0.70 |
0.70 |
| comp_4 |
austria |
NZ 2050 |
2030 |
0.20 |
0.20 |
0.20 |
| comp_5 |
germany |
1.5C RPS |
2030 |
0.70 |
0.70 |
0.70 |
| comp_5 |
germany |
NZ 2050 |
2030 |
0.20 |
0.20 |
0.20 |
| comp_6 |
netherlands |
1.5C RPS |
2030 |
0.70 |
0.70 |
0.70 |
| comp_6 |
netherlands |
NZ 2050 |
2030 |
0.20 |
0.20 |
0.20 |
| comp_7 |
spain |
1.5C RPS |
2030 |
0.70 |
0.70 |
0.70 |
| comp_7 |
spain |
NZ 2050 |
2030 |
0.20 |
0.20 |
0.20 |
Descriptive analysis of sector_target_avg_equal_weight
per grouping_sector
Descriptive analysis of sector_target_avg_equal_weight per
grouping_sector
|
|
sector_target_avg_equal_weight
|
|
grouping_sector
|
average
|
median
|
25th_quantile
|
75th_quantile
|
|
1.5C RPS_2030
|
0.5000000
|
0.7
|
0.3
|
0.700
|
|
NZ 2050_2030
|
0.3571429
|
0.2
|
0.2
|
0.425
|
Descriptive analysis of sector_target_avg_best_case per
grouping_sector
Descriptive analysis of sector_target_avg_best_case per
grouping_sector
|
|
sector_target_avg_best_case
|
|
grouping_sector
|
average
|
median
|
25th_quantile
|
75th_quantile
|
|
1.5C RPS_2030
|
0.5000000
|
0.7
|
0.3
|
0.700
|
|
NZ 2050_2030
|
0.3571429
|
0.2
|
0.2
|
0.425
|
Descriptive analysis of sector_target_avg_worst_case
per grouping_sector
Descriptive analysis of sector_target_avg_worst_case per
grouping_sector
|
|
sector_target_avg_worst_case
|
|
grouping_sector
|
average
|
median
|
25th_quantile
|
75th_quantile
|
|
1.5C RPS_2030
|
0.5000000
|
0.7
|
0.3
|
0.700
|
|
NZ 2050_2030
|
0.3571429
|
0.2
|
0.2
|
0.425
|
Descriptive analysis of sector_target_avg_equal_weight
per grouping_sector for a country
Descriptive analysis of sector_target_avg_equal_weight per
grouping_sector for country france
|
|
|
sector_target_avg_equal_weight
|
|
country
|
grouping_sector
|
average
|
median
|
25th_quantile
|
75th_quantile
|
|
france
|
1.5C RPS_2030
|
0.175
|
0.175
|
0.1375
|
0.2125
|
|
france
|
NZ 2050_2030
|
0.575
|
0.575
|
0.4375
|
0.7125
|
Descriptive analysis of sector_target_avg_equal_weight per
grouping_sector for country austria
|
|
|
sector_target_avg_equal_weight
|
|
country
|
grouping_sector
|
average
|
median
|
25th_quantile
|
75th_quantile
|
|
austria
|
1.5C RPS_2030
|
0.525
|
0.525
|
0.4375
|
0.6125
|
|
austria
|
NZ 2050_2030
|
0.375
|
0.375
|
0.2875
|
0.4625
|
Descriptive analysis of sector_target_avg_equal_weight per
grouping_sector for country germany
|
|
|
sector_target_avg_equal_weight
|
|
country
|
grouping_sector
|
average
|
median
|
25th_quantile
|
75th_quantile
|
|
germany
|
1.5C RPS_2030
|
0.7
|
0.7
|
0.7
|
0.7
|
|
germany
|
NZ 2050_2030
|
0.2
|
0.2
|
0.2
|
0.2
|
Descriptive analysis of sector_target_avg_equal_weight per
grouping_sector for country netherlands
|
|
|
sector_target_avg_equal_weight
|
|
country
|
grouping_sector
|
average
|
median
|
25th_quantile
|
75th_quantile
|
|
netherlands
|
1.5C RPS_2030
|
0.7
|
0.7
|
0.7
|
0.7
|
|
netherlands
|
NZ 2050_2030
|
0.2
|
0.2
|
0.2
|
0.2
|
Descriptive analysis of sector_target_avg_equal_weight per
grouping_sector for country spain
|
|
|
sector_target_avg_equal_weight
|
|
country
|
grouping_sector
|
average
|
median
|
25th_quantile
|
75th_quantile
|
|
spain
|
1.5C RPS_2030
|
0.7
|
0.7
|
0.7
|
0.7
|
|
spain
|
NZ 2050_2030
|
0.2
|
0.2
|
0.2
|
0.2
|
Descriptive analysis of sector_target_avg_best_case per
grouping_sector for a country
Descriptive analysis of sector_target_avg_best_case per
grouping_sector for country france
|
|
|
sector_target_avg_best_case
|
|
country
|
grouping_sector
|
average
|
median
|
25th_quantile
|
75th_quantile
|
|
france
|
1.5C RPS_2030
|
0.175
|
0.175
|
0.1375
|
0.2125
|
|
france
|
NZ 2050_2030
|
0.575
|
0.575
|
0.4375
|
0.7125
|
Descriptive analysis of sector_target_avg_best_case per
grouping_sector for country austria
|
|
|
sector_target_avg_best_case
|
|
country
|
grouping_sector
|
average
|
median
|
25th_quantile
|
75th_quantile
|
|
austria
|
1.5C RPS_2030
|
0.525
|
0.525
|
0.4375
|
0.6125
|
|
austria
|
NZ 2050_2030
|
0.375
|
0.375
|
0.2875
|
0.4625
|
Descriptive analysis of sector_target_avg_best_case per
grouping_sector for country germany
|
|
|
sector_target_avg_best_case
|
|
country
|
grouping_sector
|
average
|
median
|
25th_quantile
|
75th_quantile
|
|
germany
|
1.5C RPS_2030
|
0.7
|
0.7
|
0.7
|
0.7
|
|
germany
|
NZ 2050_2030
|
0.2
|
0.2
|
0.2
|
0.2
|
Descriptive analysis of sector_target_avg_best_case per
grouping_sector for country netherlands
|
|
|
sector_target_avg_best_case
|
|
country
|
grouping_sector
|
average
|
median
|
25th_quantile
|
75th_quantile
|
|
netherlands
|
1.5C RPS_2030
|
0.7
|
0.7
|
0.7
|
0.7
|
|
netherlands
|
NZ 2050_2030
|
0.2
|
0.2
|
0.2
|
0.2
|
Descriptive analysis of sector_target_avg_best_case per
grouping_sector for country spain
|
|
|
sector_target_avg_best_case
|
|
country
|
grouping_sector
|
average
|
median
|
25th_quantile
|
75th_quantile
|
|
spain
|
1.5C RPS_2030
|
0.7
|
0.7
|
0.7
|
0.7
|
|
spain
|
NZ 2050_2030
|
0.2
|
0.2
|
0.2
|
0.2
|
Descriptive analysis of sector_target_avg_worst_case
per grouping_sector for a country
Descriptive analysis of sector_target_avg_worst_case per
grouping_sector for country france
|
|
|
sector_target_avg_worst_case
|
|
country
|
grouping_sector
|
average
|
median
|
25th_quantile
|
75th_quantile
|
|
france
|
1.5C RPS_2030
|
0.175
|
0.175
|
0.1375
|
0.2125
|
|
france
|
NZ 2050_2030
|
0.575
|
0.575
|
0.4375
|
0.7125
|
Descriptive analysis of sector_target_avg_worst_case per
grouping_sector for country austria
|
|
|
sector_target_avg_worst_case
|
|
country
|
grouping_sector
|
average
|
median
|
25th_quantile
|
75th_quantile
|
|
austria
|
1.5C RPS_2030
|
0.525
|
0.525
|
0.4375
|
0.6125
|
|
austria
|
NZ 2050_2030
|
0.375
|
0.375
|
0.2875
|
0.4625
|
Descriptive analysis of sector_target_avg_worst_case per
grouping_sector for country germany
|
|
|
sector_target_avg_worst_case
|
|
country
|
grouping_sector
|
average
|
median
|
25th_quantile
|
75th_quantile
|
|
germany
|
1.5C RPS_2030
|
0.7
|
0.7
|
0.7
|
0.7
|
|
germany
|
NZ 2050_2030
|
0.2
|
0.2
|
0.2
|
0.2
|
Descriptive analysis of sector_target_avg_worst_case per
grouping_sector for country netherlands
|
|
|
sector_target_avg_worst_case
|
|
country
|
grouping_sector
|
average
|
median
|
25th_quantile
|
75th_quantile
|
|
netherlands
|
1.5C RPS_2030
|
0.7
|
0.7
|
0.7
|
0.7
|
|
netherlands
|
NZ 2050_2030
|
0.2
|
0.2
|
0.2
|
0.2
|
Descriptive analysis of sector_target_avg_worst_case per
grouping_sector for country spain
|
|
|
sector_target_avg_worst_case
|
|
country
|
grouping_sector
|
average
|
median
|
25th_quantile
|
75th_quantile
|
|
spain
|
1.5C RPS_2030
|
0.7
|
0.7
|
0.7
|
0.7
|
|
spain
|
NZ 2050_2030
|
0.2
|
0.2
|
0.2
|
0.2
|


