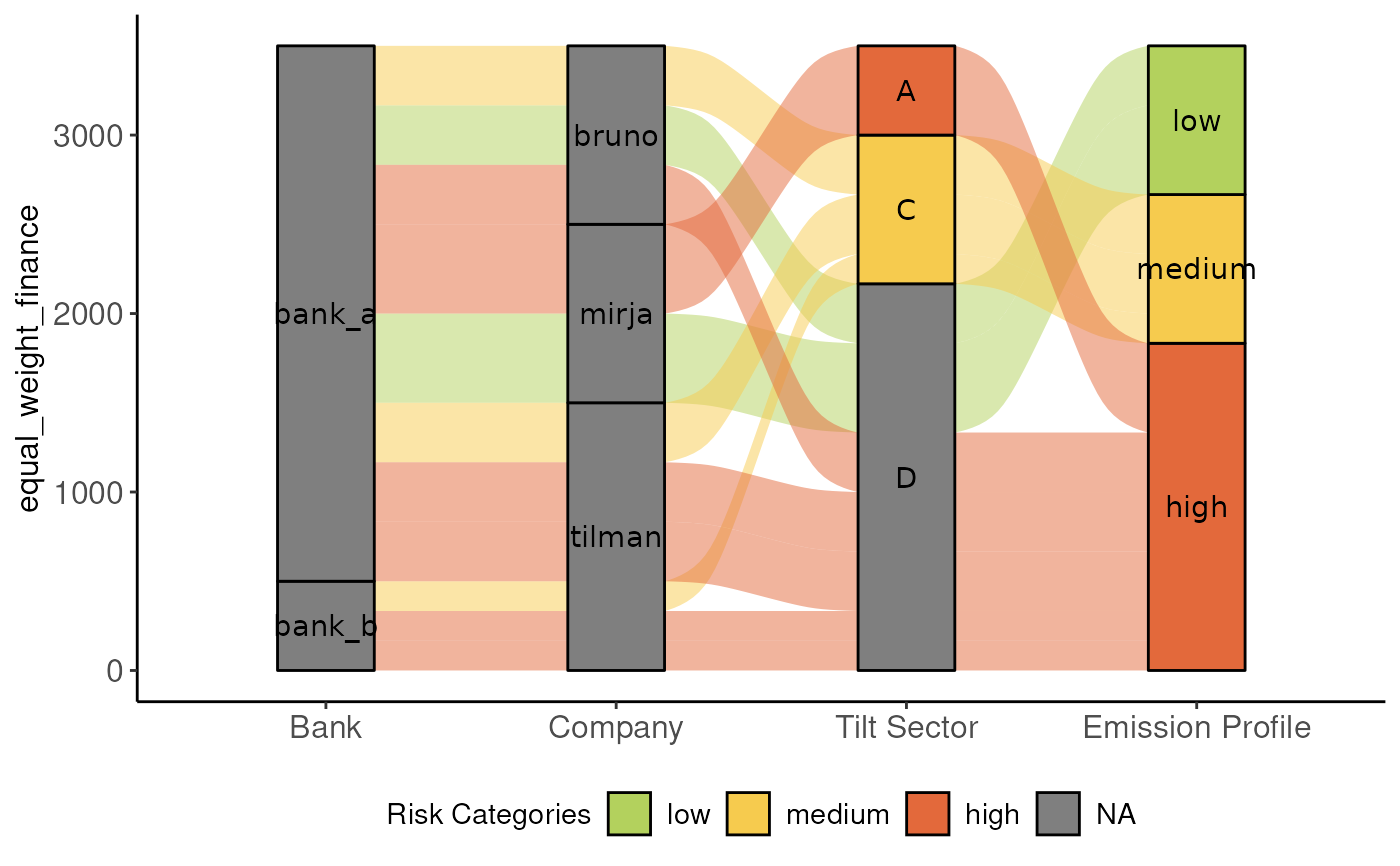
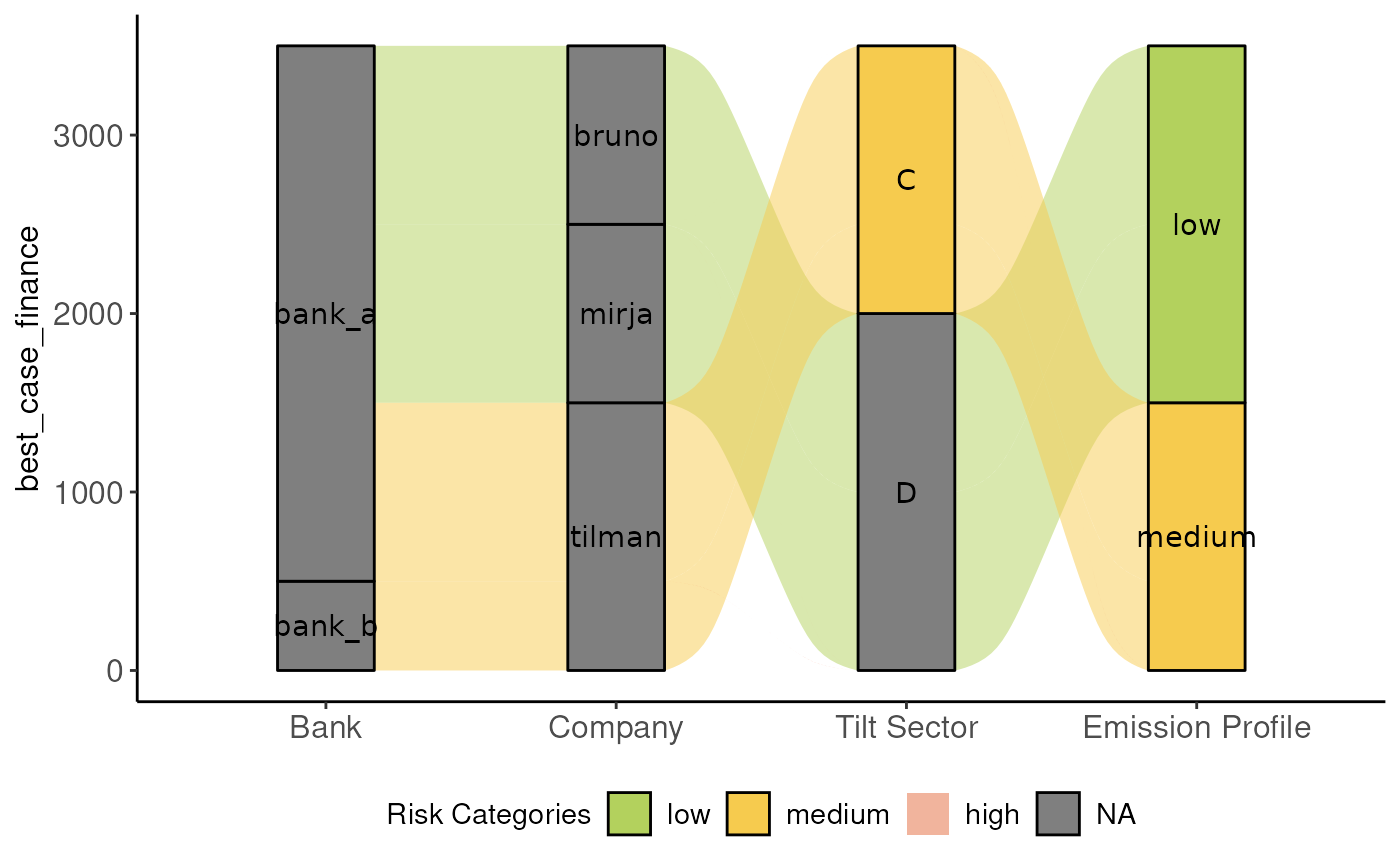
Create a sankey plot with financial data
Usage
plot_sankey(
  data,
  with_company = TRUE,
  grouping_emission = grouping_emission(),
  mode = c("equal_weight", "worst_case", "best_case")
)
Arguments
- data
A data frame like without_financial
- with_company
Logical. If TRUE, will plot a node with the company name. If FALSE, will plot without the company name node.
- grouping_emission
The mode of benchmark to plot. It can be one of "all", "unit" or "tilt_sector", "unit_tilt_sector", "isic_4digit" or "unit_isic_4digit". If nothing is chosen, "all" is the default mode.
- mode
The mode to plot. It can be one of "equal_weight", "worst_case" or "best_case". If nothing is chosen, "equal_weight" is the default mode.